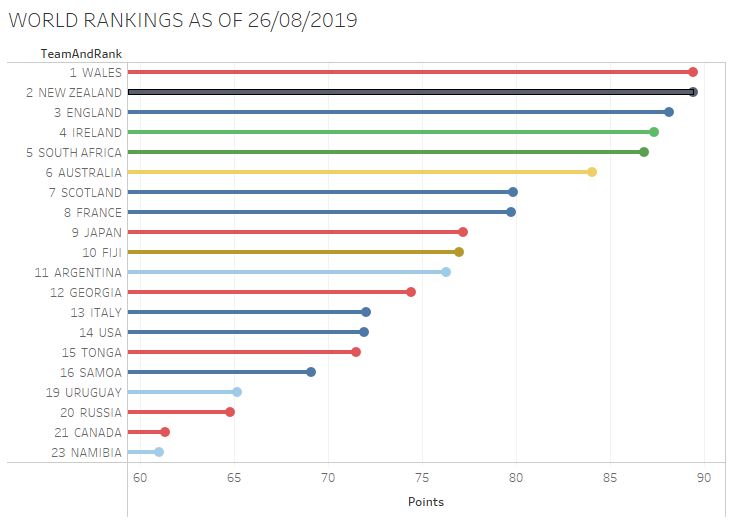
World Rankings as 28/9/2019 – Downloaded From World Rugby
It would be fair to say the World Rugby rankings have been getting some attention in the last few weeks. Wales (potentially briefly) ended New Zealand’s near decade long run as the Best Rugby Team in all the World, and a lot of people have been getting quite sniffy about it.
With Ireland, England, Wales and New Zealand all potential holders of the coveted-but-apparently-not-coveted-because-the-rankings-are-meaningless number one spot during August, considerable shade has been cast on the validity of the rankings, not least from World Rugby Vice President Agustin Pichot, who this week called the rankings “ridiculous”. Coincidentally, at the time of writing Argentina are ranked 11th in the World.
Because I like this sort of thing, I’ve been exploring how the historic rankings (from immediately prior to previous editions of World Cups) have stacked up against actual tournament and match results, to tease out if there is value to be had in them, and what this might tell us about likely outcomes of the 2019 RWC. As the rankings were first published in 2003, I’ve concentrated on the 2003, 2007, 2011 and 2015 tournaments.
Over the next few weeks I’ll be sharing how well the rankings have previously predicted tournaments and matches, what they can tell us about upsets, and how today’s can be used to predict likely outcomes of the 2019 Rugby World Cup. I might even put my head on the block and make some predictions.
“All models are wrong but some models are useful.”
– George E. P. Box in Statistical Control: By Monitoring and Feedback Adjustment
Contrary to Pichot’s opinions, when compared to actual World Cup performance, the pre-tournament rankings have proven a reliable barometer of the general world order since they were introduced in 2003. The 2003, 2011 and 2015 tournaments were all won by the team ranked number 1 at the outset (England, New Zealand, New Zealand respectively). Only the 2007 edition differed, with South Africa beginning the tournament ranked 4th.
At the individual match level, the rankings are impressively powerful indicators of likely match outcomes. Even without accounting for home advantage, the higher ranked team won 86% of world cup matches, consisting of 165 victories, two draws (Japan v Canada on both occasions; 2007 and 2011) and 25 upsets (13%).
Breaking the data down further and looking at individual tournaments, the rankings’ prediction rate is also consistently good.
While 2007 stands out here with more than twice the number of upsets than other tournaments (which is likely to be consistent with most people’s memories), its number of successful predictions still compares favourably to the FIFA official rankings ahead of the 2018 Football World Cup, which correctly predicted 59% of results (38 of 64 matches going to form, nine draws, twenty seven upsets).
The story is similar at pool stage, where outcomes are again strongly explained by pre-tournament ranking positions, and expected progression to the knockout stage is generally unaffected by any difference between actual and expected position happening elsewhere in the pools.
Pre-tournament rank vs pool stage outcomes.
In 2003, the pool winners and runners up went exactly to form, with all of the expected teams qualifying, and as winners / runners up as expected. In 2011 and 2015, only one team made it out of the groups “unexpectedly”, and in both cases at the expense of a team ranked marginally above them. 2011 also featured Australia and Ireland swapping positions as winners and runners up, but nevertheless both qualified for the knockout stages as expected.
2007, again, was a different story, with the high number of upsets significantly altering the outcomes of several pools. Fiji and Argentina in particular significantly out-performed their rank, and all pools saw a final order that was not predicted by their rankings.
So far so superficial. Where the ranking system becomes really interesting is when we start to explore the ranking points rather than the ranking positions, and compare these with actual score-lines. In the chart below I’ve plotted the difference in ranking points (highest ranked – lowest ranked) of two teams against the points difference in each match. A negative points difference means the lower ranked team won, constituting an upset.
All World Cup Matches from 2003, 2007, 2011 and 2015. The line of best fit estimates that a difference of 1 ranking point difference is worth an expected 2.4 points in a match (Rsq 75%), not accounting for home advantage.
Here we can see a strong relationship between these two factors (within reasonable bounds of uncertainty), which gives us a sense of how the ranking model can outline the relative strength of any two teams, regardless of whether they’ve recently played each other (which, after all, is the whole point). The linear trend plotted on this chart (and there are certainly more sophisticated approaches) equates to about 2.4 match points for every ranking point difference between the two teams. To put this into context, at the time of writing New Zealand and Wales are separated by an incredibly small margin in real match terms, worth about 0.07 points, or roughly 2% of a drop goal.
So can we trust them or not?
Yes. We can trust them. Just not blindly. While they’re definitely informative, we need to consider how we look at them. While the rank positions are in themselves nice accolades, the ranking points (and in particular relative difference between the points of two teams) are far more useful in understanding the relative strength of different teams. But it’s all the same model, and while it’s not perfect, it’s certainly not ridiculous.
In my next post, I’ll be looking at how we can take this a bit further to try and understand the probabilities of match outcomes, and apply a bit of context to the likelihood of some famous upsets.
[…] my last post I made the case that the Rugby World Rankings represent a useful (if imperfect) proxy for the relative strength of any tw…, and using these ranks we can contextualise this result in the light of other upsets. However, with […]
[…] an excellent post after Wales briefly took top spot at the end of August, Dave Thomas studied the historical value of pre-tournament rankings – and, significantly, of teams’ ranking …. While other prediction models continue to back New Zealand as World Cup winners over the field, in […]


Great topic, use of graphs and very well written. Here’s hoping the rankings pay off as an Irish man!
LikeLiked by 1 person
[…] my last post I made the case that the Rugby World Rankings represent a useful (if imperfect) proxy for the relative strength of any tw…, and using these ranks we can contextualise this result in the light of other upsets. However, with […]
LikeLike
[…] an excellent post after Wales briefly took top spot at the end of August, Dave Thomas studied the historical value of pre-tournament rankings – and, significantly, of teams’ ranking …. While other prediction models continue to back New Zealand as World Cup winners over the field, in […]
LikeLike